
- What is the auction insights report?
- Where do you find auction insights, and which campaigns have it?
- What does each auction insights column tell you to do?
- Lost to budget or lost to rank: which problem do you have?
- What do overlap rate and outranking share tell you about a rival?
- When is impression share worth chasing?
- How should a contractor use this report each month?
- FAQ
What is the auction insights report?
The auction insights report lists the other advertisers who showed up in the same searches your ads were in. It names them by their display domain. Next to each one it shows how often they appeared, how often they beat you, and how often you beat them. It is a comparison, not a spy tool.
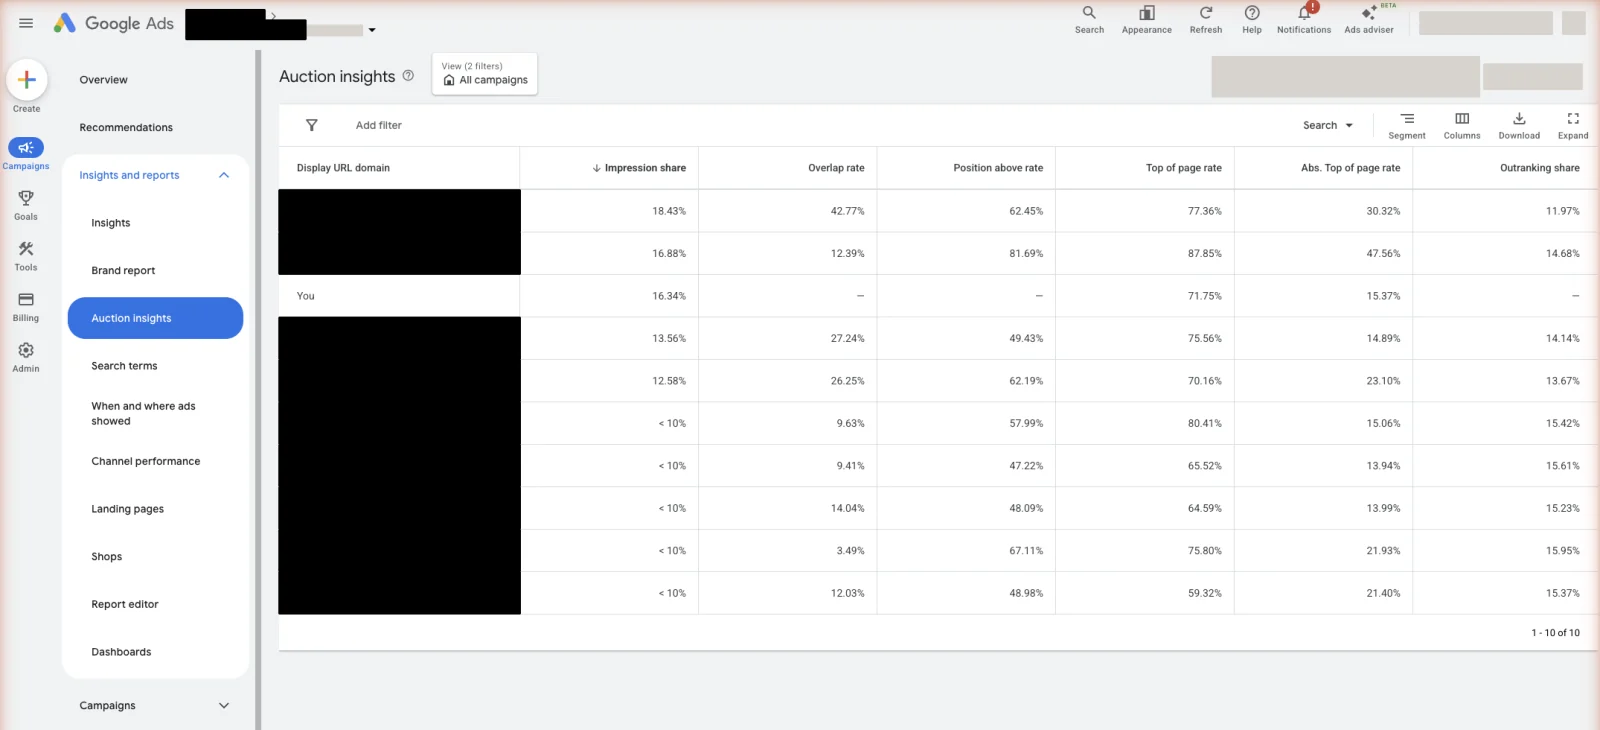
The report only covers auctions you were actually in. If your budget ran dry at 2pm, the afternoon does not exist in this report. So read it as a picture of your slice of the market, not the whole market.
Where do you find auction insights, and which campaigns have it?
Open a Search campaign, go to Insights and reports, then Auction insights. You can also select one or more keywords, ad groups, or campaigns in the table and pull the report for just those. Search campaigns give the full six columns. Shopping gives three. Performance Max gives you the Search and Shopping views, split by ad type.
Two things stop the report appearing. Google only builds it for keywords and ad groups that clear a minimum level of activity, so a brand new campaign has nothing to show. And a keyword with almost no impression share may not generate a report at all. If yours is blank, that is usually the reason, not a bug.
Pull it at the keyword level, not just the campaign level. Campaign level blends your emergency searches with your quoting searches and hides the answer. Keyword level tells you who is fighting you for the jobs that pay.
What does each auction insights column tell you to do?
Read every column as a decision, not a score. Here is what each one means and the move it points at.
| Column | What it means | The move |
|---|---|---|
| Impression share | The share of searches you were eligible for where your ad actually showed | Below 100%, find out why in the next section |
| Overlap rate | How often another advertiser’s ad showed when yours did | The two or three highest names are your real market. Ignore the rest |
| Outranking share | How often your ad ranked higher than theirs, or showed when theirs did not | Under 50% against a real rival means you are losing the head to head |
| Position above rate | How often their ad ranked above yours when you both showed | The same fight from their side. Use it to confirm outranking share |
| Top of page rate | How often your ad showed above the organic results | High impression share with a low rate here means you show, but low down |
| Absolute top of page rate | How often your ad was the very first ad on the page | Worth paying for on emergency searches. Rarely worth it anywhere else |
One column is missing from that list on purpose. The report tells you your impression share, but not why you lost the rest. That answer sits on the campaigns table next to it, and it is the most useful number in this whole exercise.
Lost to budget or lost to rank: which problem do you have?
Add two columns to your campaigns table: search lost impression share (budget) and search lost impression share (rank). They split the impressions you missed into two very different problems with two very different fixes. Read them alongside auction insights every single time. One costs money to fix. The other costs work.
Lost to budget means the searches were there and your money ran out. You have two honest options.
- Raise the daily budget, if the campaign’s cost per booked job is already under what a job is worth to you.
- Tighten the targeting instead, if it is not. Cut the hours, the radius, or the keywords that spend without booking. That buys back impressions for free.
Most contractors reach for option one. Option two is usually the better first move, because you are already paying for searches that were never going to book. There is one catch to know. If your campaign is on a target based bid strategy and it says “Limited by budget”, it delivers at your target rather than beating it. So raising the budget there buys more volume at the same cost per job, not cheaper jobs.
Lost to rank means more budget will not help you. Your ad simply was not strong enough to show. That is Quality Score, ad relevance, and the landing page, in that order, before you touch the bid. Raising the bid to fix a rank problem is the most expensive way to solve it. Read Quality Score for local service accounts first, then decide.
If both numbers are large, fix rank first. A better Quality Score lowers what each impression costs you, which stretches the same budget further. Do it the other way round and you just pay more for the same weakness.
What do overlap rate and outranking share tell you about a rival?
Overlap rate answers a question worth real money: who is actually in my market? A roofer in your city with a 70% overlap rate is in seven out of every ten auctions you appear in. A name at 4% is background noise. Sort by overlap rate and the top two or three are the only advertisers worth another thought.
Then check outranking share against those two or three only. It tells you how the head to head is going. Above 50% and you are winning more of the shared auctions than you lose. Below 50% and they are beating you, which sends you straight back to the lost-to-rank question above.
Watch for names that are not contractors. Lead sellers like Angi, HomeAdvisor and Thumbtack bid hard on trade searches so they can sell you that same homeowner later. Charming. A high overlap rate with a lead seller is not a competitor problem and there is no head to head to win. It is just what the auction looks like in home services.
What the report does not show you is the part everyone wants. You cannot see their budget, their bid, their Quality Score, their close rate, or whether any of it makes them money. A rival sitting at 90% impression share might be losing money on every job they book. You have no way to tell from here, so do not copy them.
When is impression share worth chasing?
Only on the searches that book jobs. Impression share on a search that never turns into work is just a bigger bill with a nicer chart. Split your keywords into the ones that have produced booked jobs and the ones that have not, then only look at impression share on the first group. Everything else is a distraction.
Three rules keep this report honest:
- Chase impression share only where the money comes back. A burst pipe search at 3am and a “cost to replace windows” search do not deserve the same effort. Put the impression share fight on the emergency and high-ticket searches.
- Expect costs to climb past about 80%. Once you hold most of the impressions for a search, the last few points cost the most. At that point the growth is in a new service line or a wider area, not a higher bid.
- Watching a competitor is not a strategy. Knowing that a rival outranks you 60% of the time changes nothing on its own. The fix is always in your account: the offer, the ad, the page, the tracking. That is the same stance we take on vanity numbers in the numbers worth watching.
We check this report monthly, not weekly. It moves slowly and it rewards patience. The search terms report is the weekly one, because that is where money actually leaks.
How should a contractor use this report each month?
Fifteen minutes, once a month, in this order. The goal is one decision, not a list of observations.
Changing two things at once means you learn nothing from either. If you want to test a change properly instead of guessing, that is what experiments are for.
Fifteen minutes a month is not much, and it is still the first thing that gets skipped in a busy season. If it never happens in your business, that is a quiet argument for handing the account to someone whose whole job is reading these reports.
Stop reading · start fixingSee where your pipeline is leaking.Free 15-minute Leak Finder. We pull up your numbers, name your biggest leak, and hand you a 90-day plan. No sales script, no hard close.Find My Google Ads LeaksFAQ
What is a good impression share in Google Ads? There is no universal number. On emergency searches that book jobs, aim high, because the homeowner calls whoever they see first. On research searches, a low share is fine and often smarter. Judge it against your cost per booked job, not against a benchmark from a blog.
Can my competitors see my auction insights? Yes. They see the same report with your display domain in it, as long as they clear the same activity threshold. Nobody sees anybody’s bids, budgets or conversion numbers. Everyone only sees who showed up and who ranked above whom.
Why is my auction insights report empty? Usually not enough activity. Google only builds the report for keywords and ad groups above a minimum level of impressions, so new campaigns and low-volume keywords show nothing. Wait for data, or pull the report at campaign level instead of keyword level.
Does auction insights show competitor bids or budgets? No. It shows how often each advertiser appeared and how the ranking went between you. Bids, budgets, Quality Scores, conversion rates and profit are all hidden. Any tool claiming to show you a rival’s exact budget is estimating, and usually badly.
Is average position still in the report? No. Google removed average position years ago. Impression share, top of page rate and absolute top of page rate replaced it, and they are better questions anyway. Position tells you where you showed. These tell you how often you showed at all.
Should I bid on my competitor’s name? That is a separate decision with its own rules, costs and risks. Auction insights tells you who is worth considering. What you actually do about them is covered in how to build a competitor campaign.


